Code:
import matplotlib.pyplot as plt
import numpy as np
import matplotlib.pyplot as plt
def compute_temp_dist(n):
NX = n
NY = n
t = np.zeros((NX + 2, NY + 2))
# Add boundary conditions
t[:, 0] = 100.0
t[0, :] = 100.0
# Compute temperature distribution
for outeriterations in range(10000):
for i in range(1, NX + 1):
for j in range(1, NY + 1):
t[i, j] = 0.25 * (t[i + 1, j] + t[i – 1, j] + t[i, j + 1] + t[i, j – 1])
return t
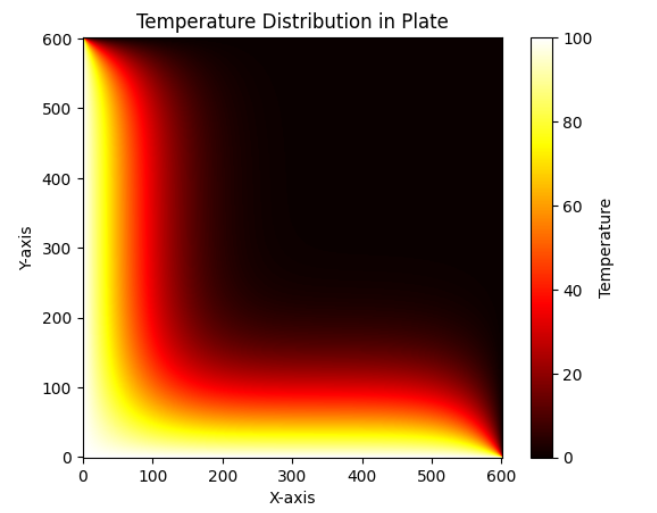
def plot_temp_dist(t):
plt.imshow(t, cmap=’hot’, origin=’lower’)
plt.colorbar(label=’Temperature’)
plt.xlabel(‘X-axis’)
plt.ylabel(‘Y-axis’)
plt.title(‘Temperature Distribution in Plate’)
plt.show()
t = compute_temp_dist(600)
plot_temp_dist(t)
Output:
Sagemath Code and visual
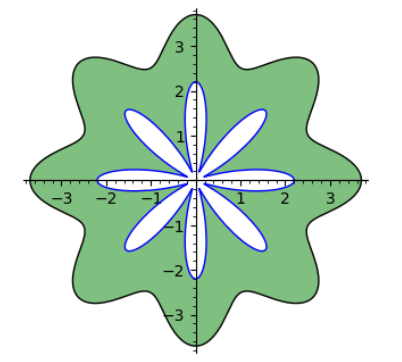
Code:
var(‘t’)
polar1=polar_plot(0.5*cos(8*t)+3.2,0,2*pi, color=’black’)
polar2=polar_plot(cos(8*t)+1.2,0,2*pi, fill=0.5*cos(8*t)+3.2,fillcolor=’green’)
show(polar1+polar2, figsize=5)
Output: